Benchmarks
Benchmarks
This page compares php-fpm-nginx against the most-used PHP container images
on dedicated cloud hardware, with enough methodology detail that you can
attack the numbers - or reproduce them. Every harness script is in the repo
under bench/cloud/.
Three promises up front:
- No composite scores. Each workload is reported separately; they stress different things and averaging them would manufacture a winner.
- Losses are printed, not buried. Where a competitor beats these images, the number is in the table and the reason (when we found it) is named.
- Everything needed to reproduce is disclosed: hardware, kernel, image digests, load-generator settings, run counts, and the aggregation rule.
Results at a glance
Same-pass, same-rig medians (full tables and method below):
| Workload | 2 vCPU | 8 vCPU |
|---|---|---|
| Laravel (framework path) | +6% vs ServerSideUp (135 vs 127 rps) | tie (1,226-1,244 vs 1,244 rps) |
| Static files (nginx layer) | +190% (39.4k vs 13.6k rps) | +69% (107k vs 64k rps) |
| CPU-bound PHP | +2% (within noise) | +2% (within noise) |
| Trivial PHP round trip | -7% on the socket default (1.6.1); +9% with keepalive opt-in | -3% on the socket default |
| p99.9 under open-loop load (Laravel) | 360ms vs 345ms | 9.9ms vs 10.0ms |
The honest summary: on framework workloads and the web-server layer these images win or tie; the trivial-request transport path is within -7%/-3% of ServerSideUp since 1.6.1 made the unix socket the multi-service default (measured on this rig - the tables below show every mode), with the keepalive opt-in flipping 2 vCPU to +9%. Details, losses and caveats below.
The rig
Two separate dedicated-vCPU servers (no shared-core steal, no laptop thermal noise), load generated over the private LAN so the generator never competes with PHP for CPU:
| Role | Machine | CPU | RAM | OS / kernel | Docker |
|---|---|---|---|---|---|
| System under test | Hetzner CCX33 | 8 × AMD EPYC-Milan (dedicated) | 32 GB | Ubuntu 24.04.5, 6.8.0-138-generic | 29.8.0 |
| Load generator | Hetzner CCX23 | 4 × AMD EPYC-Milan (dedicated) | 16 GB | Ubuntu 24.04.5, 6.8.0-138-generic | - |
One container runs at a time on the SUT, pinned with --cpus and --memory
(cgroup v2). Every result in this page comes from this rig on 2026-09-11.
Why not a laptop: we first ran this comparison on an M-series MacBook. The ranking did not transfer - Apple cores are 2.5-3× faster per core than cloud EPYC vCPUs, which flattens per-request fixed costs that dominate on the hardware people actually deploy to. The laptop numbers are retired.
Contenders
All images at their :8.5 tags as shipped, pulled 2026-09-11 (digests below).
Configuration deviations from defaults are listed explicitly - nothing else
was tuned:
| Label | Image | Deviation from image defaults |
|---|---|---|
| cbox 1.6 | ghcr.io/cboxdk/php-baseimages/php-fpm-nginx:8.5-bookworm |
none (1.6 defaults, built from source at the benchmarked commit) |
| cbox 1.6 + keepalive | same | NGINX_FASTCGI_KEEP_CONN=on (documented opt-in) |
| cbox 1.6.1 socket | same | PHP_FPM_LISTEN=unix - the php-fpm-nginx default since 1.6.1 (measured pre-flip, so socket rows are labeled separately) |
| serversideup | serversideup/php:8.5-fpm-nginx |
none |
| serversideup + opcache | same | PHP_OPCACHE_ENABLE=1 (their documented production switch; their default ships OPcache off) |
| webdevops | webdevops/php-nginx:8.5 |
none |
| trafex | trafex/php-nginx:latest |
none |
| apache | php:8.5-apache-bookworm |
none |
| frankenphp | dunglas/frankenphp:php8.5-bookworm |
none |
Image digests as pulled:
serversideup/php:8.5-fpm-nginx@sha256:8f8c2f010ac5082ff3b42dbd1c2b2a77aa8a7ee0adb96d49920f32f45ae730e8
webdevops/php-nginx:8.5@sha256:4900627696bffe4d24aacc20a2cc74df7719ada62250b6b92a5a136ff51d1ef7
trafex/php-nginx:latest@sha256:8a82bac3c9c4853e4b0bd33edfbbb0f30d4b3546f177a35944047c3856ac72e7
php:8.5-apache-bookworm@sha256:824adc2ce556dd5e05e816b1597cad90948e44b0b36ac2642f7449b801fb8dbd
dunglas/frankenphp:php8.5-bookworm@sha256:519536270a58121c28f63bdb97f9a330b2e53922029792631cf50fe953ecd8d0
The cbox image was built on the SUT from the repository at the benchmarked
commit with the same-day cbox-init build injected - what 1.6.0 ships.
Workloads
Four request paths, because "PHP performance" is at least four different questions:
| Endpoint | What it exercises | What dominates the cost |
|---|---|---|
/hello.php |
the full nginx → FastCGI → PHP-FPM round trip on a trivial script | per-request fixed cost: FastCGI transport, process handoff |
/work.php |
CPU-bound PHP (hashing/loops, no I/O) | raw PHP execution speed - this one mostly measures the CPU, and ties across FPM images are expected |
/static.html |
nginx alone, PHP untouched | the web-server layer and its defaults |
/items (Laravel) |
an uncached Laravel 12 route with a SQLite query, fresh composer create-project, no config:cache |
framework code: thousands of function calls, autoloading, container resolution |
The Laravel fixture is deliberately not optimized (no cached config or routes) - it represents the framework-heavy path, not a tuned deployment.
Method
- Throughput:
wrk -t4 -c64 -d20s, from the load-generator box over LAN. Three runs per endpoint per configuration after a 5 s warmup; tables report the median of the three, ± the standard deviation, andn. - Acceptance: a run counts only if it produced zero non-2xx responses. Every number on this page passed that gate.
- Tail latency:
wrkis a closed-loop generator - when the server stalls,wrkpolitely stops sending, which hides tail latency (coordinated omission). Tail numbers therefore come from a separate open-loop pass withoha 1.16 --latency-correction, at a fixed rate of 60% of that same endpoint's measured wrk throughput. - Sequencing: one container at a time on the SUT; each configuration gets a fresh container, warmup, and a fixed measurement window. The scheduler announces the active configuration on an HTTP state endpoint and the client measures what is announced - no human in the loop.
- Load generator headroom was verified: the static-file workload measures 42k+ rps through the same client, so the generator is not the bottleneck at any PHP-bound number below.
Results
The field at 2 vCPU / 1 GB
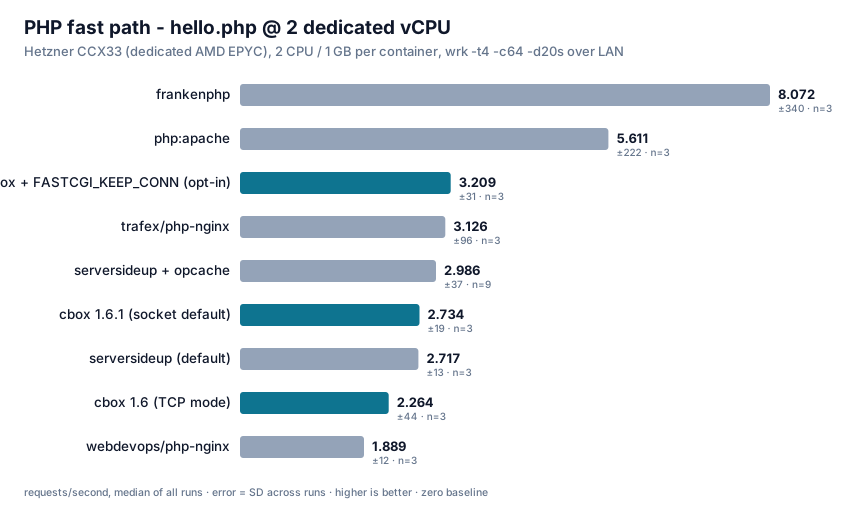
hello.php is the transport benchmark: nearly all of its cost is the
nginx→FPM round trip. Apache and FrankenPHP skip FastCGI entirely (mod_php /
embedded SAPI), which is why they top this chart - and why neither leads the
Laravel chart below. Among the FPM+nginx images, the spread is the FastCGI
transport: with both stacks on their socket defaults (ours since 1.6.1) the
gap is -7%; the keepalive opt-in flips it to +9% the other way. An
interleaved n=9 A/B confirmed the socket costs nothing on the Laravel
workload (+0.4% vs TCP). Trafex's Alpine image
posts a strong hello number but drops to less than half the field's
throughput on CPU-bound work (musl allocator).
| Configuration | hello.php | work.php | static.html |
|---|---|---|---|
| cbox 1.6 (TCP mode) | 2,264 ±44 | 384 ±11 | 39,445 ±3,740 |
| cbox + keepalive (opt-in) | 3,209 ±31 | 397 ±4 | 40,867 ±1,022 |
| cbox 1.6.1 (socket default) | 2,734 ±19 | 379 ±2 | 40,624 ±1,221 |
| serversideup + opcache | 2,952 ±58 | 376 ±4 | 13,599 ±131 |
| serversideup (default) | 2,717 ±13 | 370 ±3 | 13,621 ±489 |
| webdevops | 1,889 ±11 | 378 ±2 | 15,022 ±60 |
| trafex | 3,126 ±96 | 152 ±7 | 14,670 ±306 |
| apache (mod_php) | 5,611 ±222 | 414 ±32 | 7,112 ±105 |
| frankenphp (classic) | 8,072 ±340 | 673 ±66 | 18,081 ±819 |
(rps, median ±SD; cbox and serversideup rows n=9 same-pass; field rows n=9 from the field pass on the same rig and day)
Laravel at 2 vCPU / 1 GB
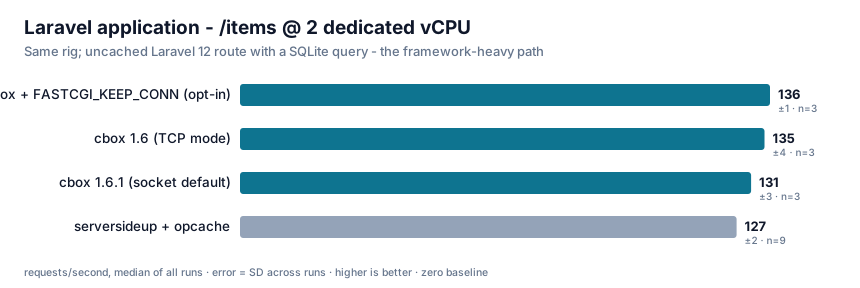
The workload the transport chart cannot predict: 135 vs 127 rps (+6%) on the defaults, and the ordering of the micro chart inverts - everything here is dominated by framework execution, where worker sizing and what the image loads into PHP decide the outcome.
Static files
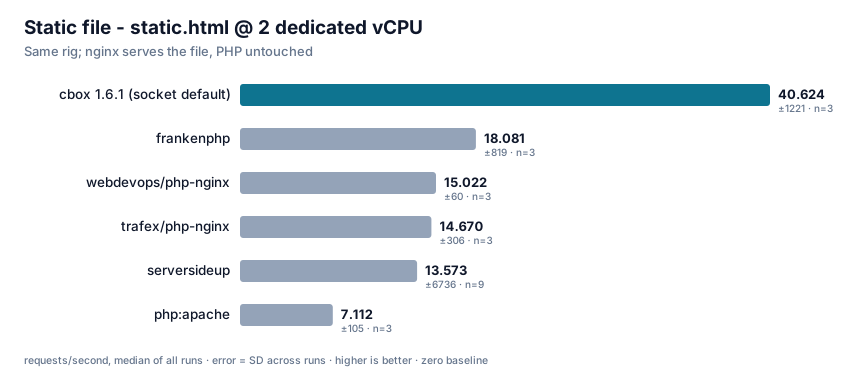
Every PHP app serves assets. This is the nginx layer itself - 2.9× the closest FPM competitor, and the gap persists at 8 vCPU (107k vs 64k).
Scaling to 8 vCPU / 8 GB
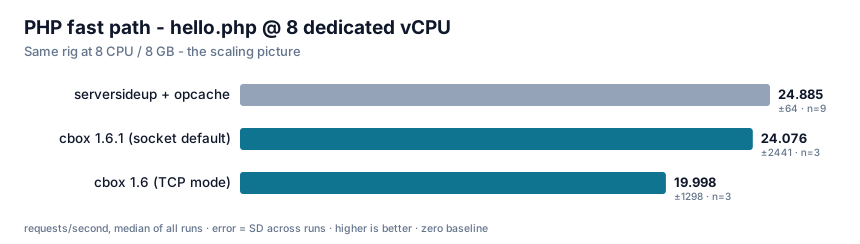
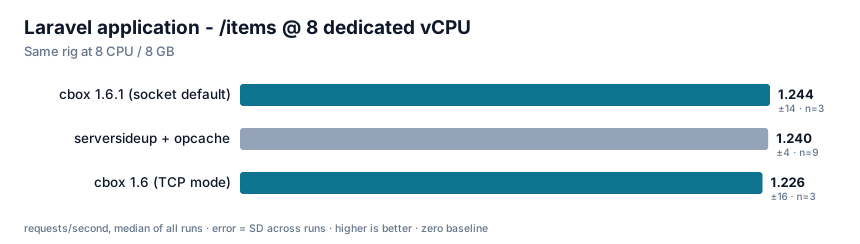
| Configuration | hello.php | work.php | Laravel /items |
|---|---|---|---|
| cbox 1.6 (TCP mode) | 19,998 ±1,298 | 3,653 ±3 | 1,226 ±16 |
| cbox 1.6.1 (socket default) | 24,076 ±2,441 | 3,733 ±11 | 1,244 ±14 |
| serversideup + opcache | 24,868 ±28 | 3,592 ±5 | 1,244 ±3 |
At 8 CPUs both stacks converge on ~20 workers and the Laravel result is a statistical tie. The hello gap is again the transport; the socket opt-in closes it to -3%.
Tail latency (open loop, coordinated-omission corrected)
oha --latency-correction at 60% of each configuration's measured
throughput, 45 s:
| Configuration | Workload | rate/s | p50 | p99 | p99.9 |
|---|---|---|---|---|---|
| cbox 1.6 @8c | Laravel | 735 | 5.1ms | 7.1ms | 9.9ms |
| serversideup @8c | Laravel | 746 | 5.4ms | 7.1ms | 10.0ms |
| cbox 1.6 @2c | Laravel | 78 | 10.4ms | 168ms | 360ms |
| serversideup @2c | Laravel | 75 | 11.3ms | 177ms | 345ms |
| cbox 1.6 @2c | hello | 1,345 | 1.0ms | 1.6ms | 3.3ms |
| cbox + keepalive @2c | hello | 1,924 | 0.8ms | 1.3ms | 742ms |
| cbox + unix socket @2c | hello | 1,633 | 0.9ms | 1.4ms | 4.6ms |
| serversideup @2c | hello | 1,767 | 0.9ms | 1.5ms | 3.3ms |
Two things worth reading out of this table: the 8-CPU Laravel tails are sub-10ms and effectively identical across stacks - and the keepalive opt-in's p99.9 spike is exactly why it is an opt-in (see the findings section).
What we found and changed along the way
The honest part: this benchmark caught two of our own defaults costing real throughput, and both were changed in 1.6.0.
The OpenTelemetry extension taxed every function call. Our standard-tier
image loaded the opentelemetry extension by default, on the assumption
(stated in the Dockerfile, wrongly) that it was inert until an OTel SDK was
installed. Loading it enables the Zend observer API, which adds a check to
every PHP function call: measured at -18.5% on the Laravel workload and
0% on tight-loop code - the cost scales with function-call density. It also
explained most of our Laravel deficit against ServerSideUp in early passes.
Since 1.6.0 the extension is installed but not loaded; PHP_OPENTELEMETRY=true
loads it (and that is the honest cost of running it - the tax is the observer
API itself, not our packaging). Worth knowing before you pay it: for Laravel
apps, cboxdk/laravel-telemetry
gets you application telemetry through the framework's own hooks in userland,
with no observer API and no measurable throughput cost.
open_basedir silently disabled the realpath cache. Setting it - which we
did by default as LFI defense-in-depth - turns PHP's realpath cache off
entirely, measured at -39% on the Laravel workload. Since 1.6.0 the
restriction is opt-in via PHP_OPEN_BASEDIR; the environment reference
documents the tradeoff and a curated path list.
We also measured FastCGI keepalive (NGINX_FASTCGI_KEEP_CONN=on): +39% on
hello.php (it removes the per-request TCP connect) and +3% on Laravel - but
open-loop measurement showed it can produce multi-second p99.9 spikes at high
worker counts when pooled connections pin to recycling FPM workers. It stays
opt-in, recommended for micro-request/API workloads only.
Fairness notes and limitations
- ServerSideUp ships OPcache disabled by default. We benchmarked them
primarily with
PHP_OPCACHE_ENABLE=1(their documented production setting) because default-vs-default on Laravel would be a landslide that says nothing about their engineering. Their default-off choice is still worth knowing about. - One Laravel fixture. A fresh skeleton app with a SQLite query is not your application. The framework-path result should transfer directionally; the exact percentages will not.
- One CPU family. Everything here is AMD EPYC-Milan. We know from the retired laptop run that per-core speed shifts the relative weight of fixed costs; expect different (not opposite) numbers on other silicon.
- FrankenPHP runs classic mode (as shipped). Its worker mode is a different programming model with different application requirements and would win the micro benchmarks; comparing it as a drop-in FPM replacement would misrepresent both sides.
- The static-file result for ServerSideUp (~14k rps vs our 42k) looks like a config artifact on their nginx layer, not a PHP statement. We report it because it is real, but weight it accordingly.
- Numbers are a single day on a single pair of machines. The run-to-run SD is printed for every number; cross-pass repeats of key pairs agreed within it.
Reproducing
The whole rig is four scripts in bench/cloud/ (bootstrap + scheduler for the
SUT, bootstrap + measurer for the client). On two fresh Ubuntu 24.04 boxes
with Docker:
# on the SUT box
./bench/cloud/bootstrap-sut.sh

# on the client box
SUT_IP=<sut-ip> ./bench/cloud/bootstrap-client.sh
# results stream to ~/cbox-bench/out/results.jsonl as JSONL
The raw measurement data behind this page (every run, as JSONL) is committed
under bench/cloud/results/2026-09-11/, together with the exact image digests.
The benchmarked commit is stamped in the same directory's shas.
The schedule of configurations lives in bench/cloud/run-sut.sh. If you run
it and get materially different numbers, open an issue - with your
results.jsonl attached, disagreement is useful data.