AI usage and cost
AI usage and cost
cboxdk/laravel-telemetry instruments laravel/ai
with the OpenTelemetry GenAI conventions. When those metrics reach your
Prometheus, the AI page appears under Activity. Until then it stays out
of the navigation: it is detected on gen_ai_.*.
Turn it on (in the emitter)
The instrumentation is on by default in the emitting app
(TELEMETRY_INSTRUMENT_AI=true). To see cost as well as tokens, give it your
model prices, per 1M tokens:
// config/telemetry.php
'instrument' => [
    'ai_pricing' => [
        'currency' => env('TELEMETRY_AI_CURRENCY', 'USD'),
        'models' => [
            'anthropic/claude-sonnet-*' => ['input' => 3.00, 'output' => 15.00, 'cache_read' => 0.30, 'cache_write' => 3.75],
            'openai/text-embedding-3-small' => ['input' => 0.02],
        ],
    ],
],
No price catalog ships with either package. A model without a price gets no cost series, so the dashboard shows it as no price, never as free.
The cost counter (gen_ai_client_cost_total) needs laravel-telemetry 3.7 or
later in the emitting app. Older versions still fill every other panel on
the page, and the cost columns show the pricing hint.
The panels
| Panel | Reads | Shows |
|---|---|---|
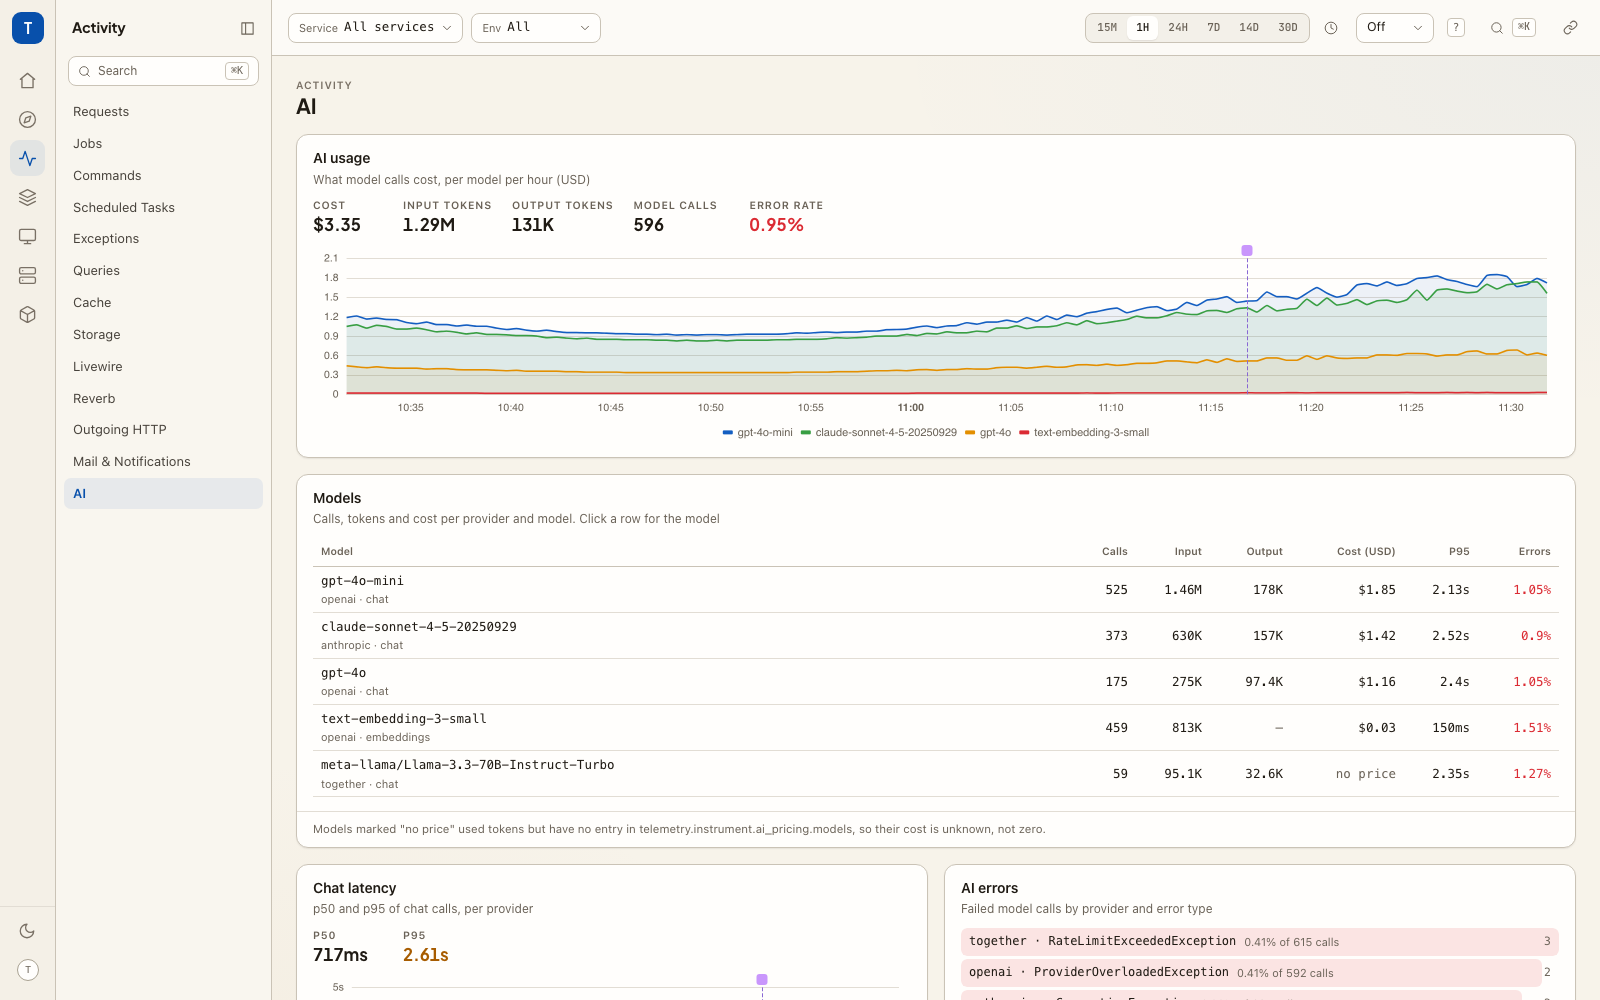
| AI usage | gen_ai_client_cost_total, gen_ai_client_token_usage_sum, gen_ai_client_operation_duration_seconds_count |
Cost per model per hour when prices are set, tokens per model per minute otherwise. Tiles: cost, input and output tokens, model calls, error rate. |
| Models | the same, plus gen_ai_client_operation_duration_seconds_bucket |
One row per provider and model (provider and chat / embeddings under the name): calls, input and output tokens, cost or no price, p95 latency, error rate. A row opens the model's page. |
| Chat latency | gen_ai_client_operation_duration_seconds_bucket{gen_ai_operation_name="chat"} |
p95 per provider over time, with the overall p50 and p95 as tiles. Embeddings are left out: they would flatten the chat lines. |
| AI errors | gen_ai_client_operation_duration_seconds_count{error_type!=""} |
Failed calls by provider and error_type, each with its share of that provider's calls. |
| AI usage by … | Loki usage records, else Tempo chat / embeddings spans |
Calls, input and output tokens, cost (or no price, with a count of unpriced calls), error rate and last call per user, declared dimension (team, tenant, …), client IP or any attribute. A value opens its entity page when it has one, its traces otherwise. |
| Recent model calls | Tempo: chat and embeddings spans |
One row per call: model and where it came from, tokens in / out (cache and reasoning tokens under them), cost, finish reason or error, duration. Sortable by time, duration or cost. A row opens the trace. |
| Slowest agent runs | Tempo: invoke_agent spans |
Agent (with when it ran and the tools it called under the name), model, tokens, cost (gen_ai.usage.cost), finish reason or error, and duration. Sortable by time, duration or cost. A row opens the waterfall with its chat and execute_tool children. |
| Agent tools | Tempo: execute_tool spans |
Runs, average and max duration per tool. A row opens the slowest run. |
The trace panels are built from a sample of recent traces (a Tempo search), not totals. Without a reachable traces backend they show the backend's error, as every trace panel does; the metric panels are unaffected.
Usage by user, team, tenant or IP
AI usage by … groups model calls by a context dimension. The picker
offers the user, every dimension the app declares with
TelemetryUi::dimension() (so a declared tenant.id or team.id shows up
by itself), the client IP, and Custom attribute… for anything else that
Telemetry::context() adds, such as plan.
The panel reads the best source available, and its footer says which:
- Usage records (exact). With
instrument.ai_usage_eventson, the emitter writes one unsampledgen_ai.client.inference.operation.detailslog record per call. Read from Loki, the panel covers every call in the period, up to 5,000 records per read; past that it says it is the most recent 5,000. - Spans (recent sample). Without records it reads the
chatandembeddingsspans, which carryuser.idand the context dimensions too. A Tempo search returns the most recent 100 traces and a few calls from each, so even at 100% sampling this is a recent sample, not a total. - Client IP.
client.addressis only on the request's root span, so IP always reads spans: the root spans above the calls ({call} << {root}), joined to the calls by trace.
Metric labels from instrument.ai_metric_labels are not read here yet;
the records already give exact numbers for any key, bounded or not.
On a user's or tenant's page
When the app emits GenAI metrics, the entity page of a user, a client IP
and every declared context dimension gets the AI usage panels on its
Metrics tab: AI usage (calls over time, tokens, cost, error rate, from
the same source as above) and that value's Model calls from Tempo, each
opening its trace. An entity that has its own detail page keeps it, and a
host can attach a different page with TelemetryUi::entityPage().
Model and agent pages
A model and an agent are entities, like a route or an outgoing host: click a
row in Models, or a model or agent name in a list, and its page opens
(/entity/ai-model?value=gpt-4o, /entity/ai-agent?value=SupportAgent).
Both appear under Entities in Explore as AI models and Agents.
The Story tab is the usual entity story over the spans carrying
gen_ai.request.model or gen_ai.agent.name. The Metrics tab holds the
detail panels:
| Page | Panels |
|---|---|
| AI model | Calls per minute with failures, Tokens per minute with cost (or No price), Latency p50 / p95, and the model's Calls list from Tempo. |
| Agent | Runs over time with runs, failures, average duration and cost, the tools its runs called, and its run log, newest first. |
Agents have no metric label, so every agent number comes from a sample of its most recent runs (one Tempo search), and each panel says so.
The Tools column in run lists comes from one structural search
({run} >> {execute_tool}). Tempo returns a few matched spans per trace, so a
run that called many tools lists the first few; the waterfall shows all of
them.
Currency
The cost counter carries no currency label. The dashboard reads
telemetry.instrument.ai_pricing.currency from its own config (USD when
unset), which is right when it runs inside the app it watches. A dashboard
watching a different app should set the same TELEMETRY_AI_CURRENCY.