Laravel Telemetry UI
Laravel Telemetry UI
cboxdk/laravel-telemetry-ui is a Laravel-native observability dashboard that
queries your existing Grafana stack — Tempo (traces), Loki (logs) and
Prometheus/Mimir (metrics) — directly. No agent, no vendor cloud, no data
leaves your infrastructure.
It is the presentation counterpart to
cboxdk/laravel-telemetry: the
emitting package defines a stable schema of metric names, span attributes and
resource attributes, and this package is schema-aware. That is what lets it
render opinionated, Laravel-shaped screens (Requests, Jobs, Queries,
Exceptions, Users…) instead of Grafana's generic panels — and link them:
click a slow route, see its traces; open a trace, see the queries and the
trace-correlated logs.
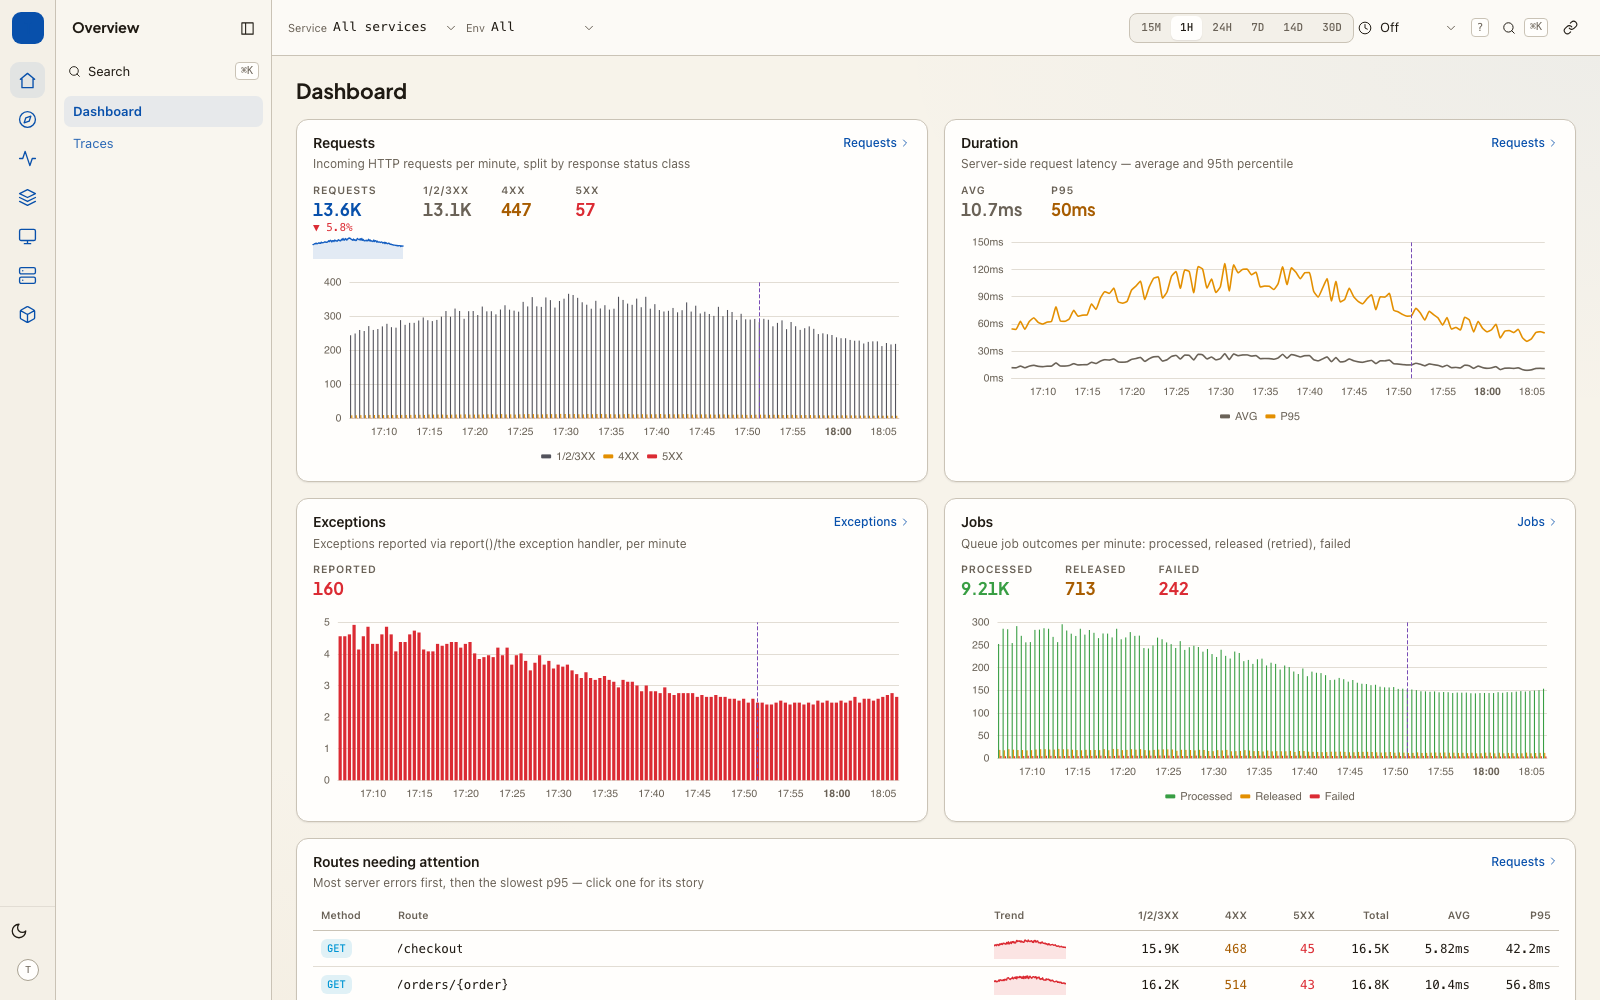
v2 is a versioned JSON API plus a prebuilt React app the package serves itself, so hosts need no Node toolchain. Everything on a page is a panel, a plain PHP class your packages can add to:
TelemetryUi::page('autoscale', 'Autoscale', group: 'Queues');
TelemetryUi::panel(AutoscaleDecisions::class, page: 'autoscale');

final class AutoscaleDecisions extends Panel
{
    public function data(): array
    {
        return $this->promChart(
            'Scaling decisions',
            $this->metric('autoscale_scaling_events_total')->rate('5m')->sumBy('queue'),
            seriesLabel: 'queue',
        );
    }
}
And any attribute your app emits can become a first-class dimension — a facet, a group-by option, a filter chip and an entity page:
TelemetryUi::dimension('billing.customer_id', label: 'Customer',
    link: fn ($id) => route('customers.show', $id));
Dimensions bend to what your app already emits. Show names instead of ids
(TelemetryUi::resolve('user.id', User::class, 'name')), read a dimension out
of another attribute when a routing layer encodes it there
(from: 'http.route', pattern: 'portal:{value}'), give that layer its own page
with routeFamily(), or declare a chart over any metric — including one from a
sidecar in another language — with metricPanel(), no panel class needed. See
dimensions & Explore and
developer integrations.
Why not just Grafana?
Grafana is generic; this dashboard knows what a Laravel app is. Routes, jobs, scheduled tasks, cache stores and users are first-class concepts, cross linked across signals. It also lives inside your app: your auth, your gate, and actions a read-only dashboard can never do — create a ticket from an exception, or hand the whole stack to an agent over MCP for incident RCA.
Documentation
- Getting started
- Core concepts: connections · pages & panels · dimensions & Explore · JSON API · configuration reference · authorization · signal correlation · infrastructure discovery
- Cookbook: web analytics & RUM · AI usage and cost · connect through a Grafana datasource proxy · emitting annotations · MCP server · embedding the dashboard in your own app
- Extension points — Developer integrations guide (start here) · custom panels · custom detail pages · custom drivers · issue trackers
- Upgrading from 1.x
- Design direction
- Architecture decision records
- Roadmap
The screens
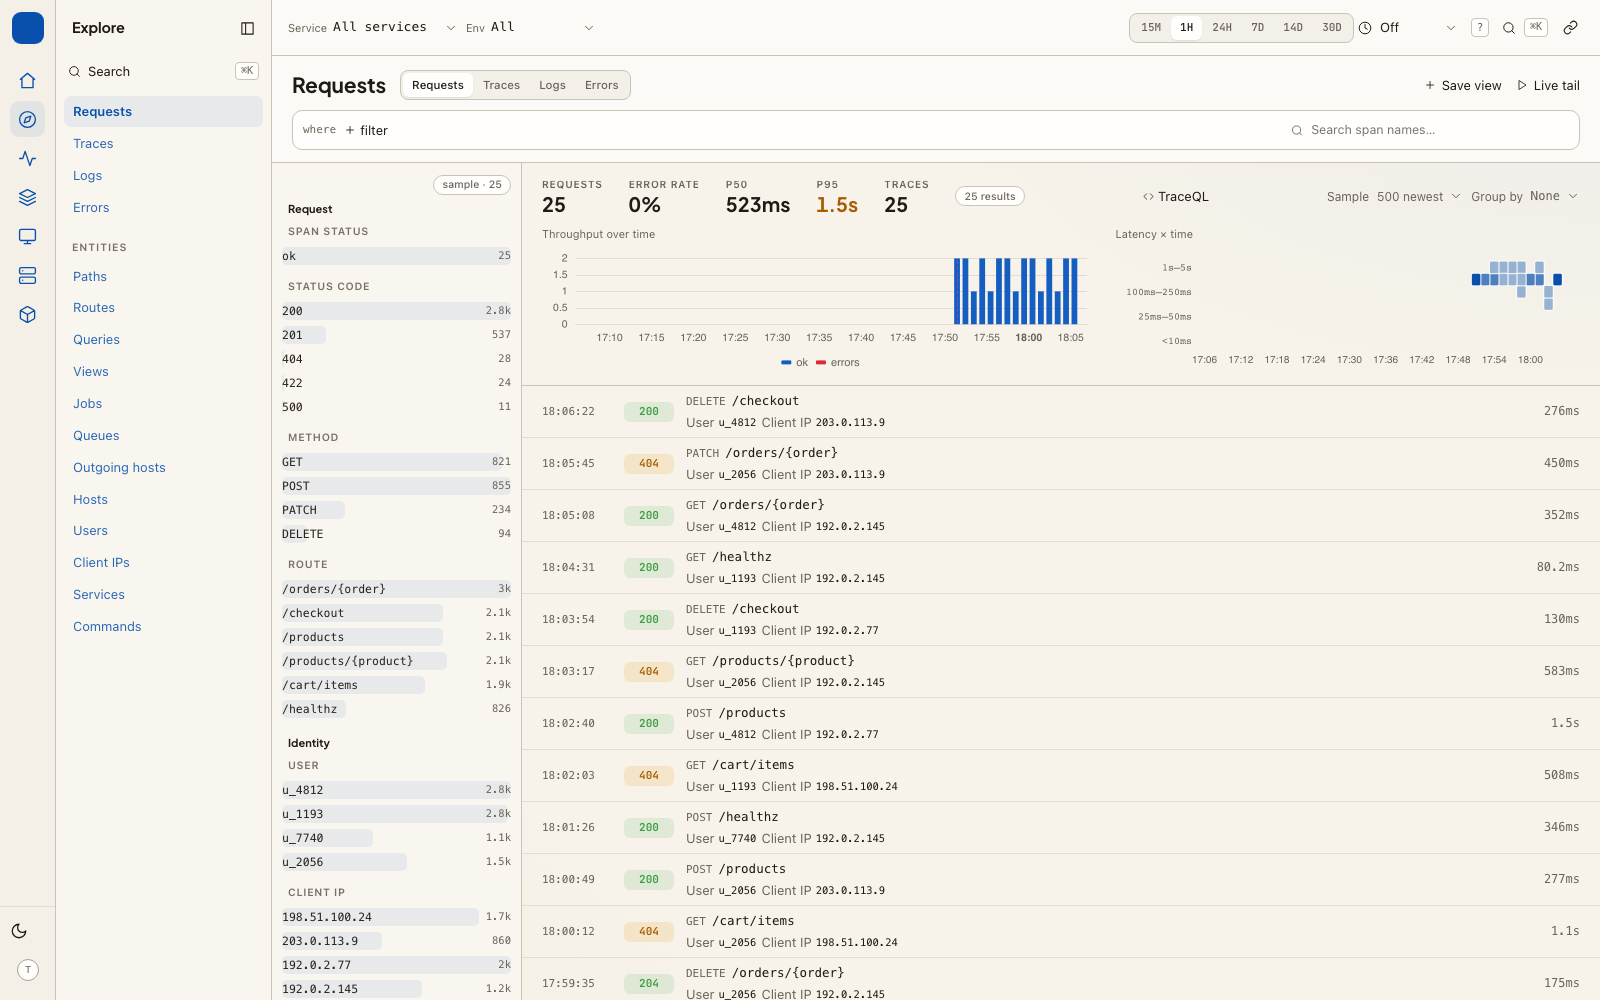
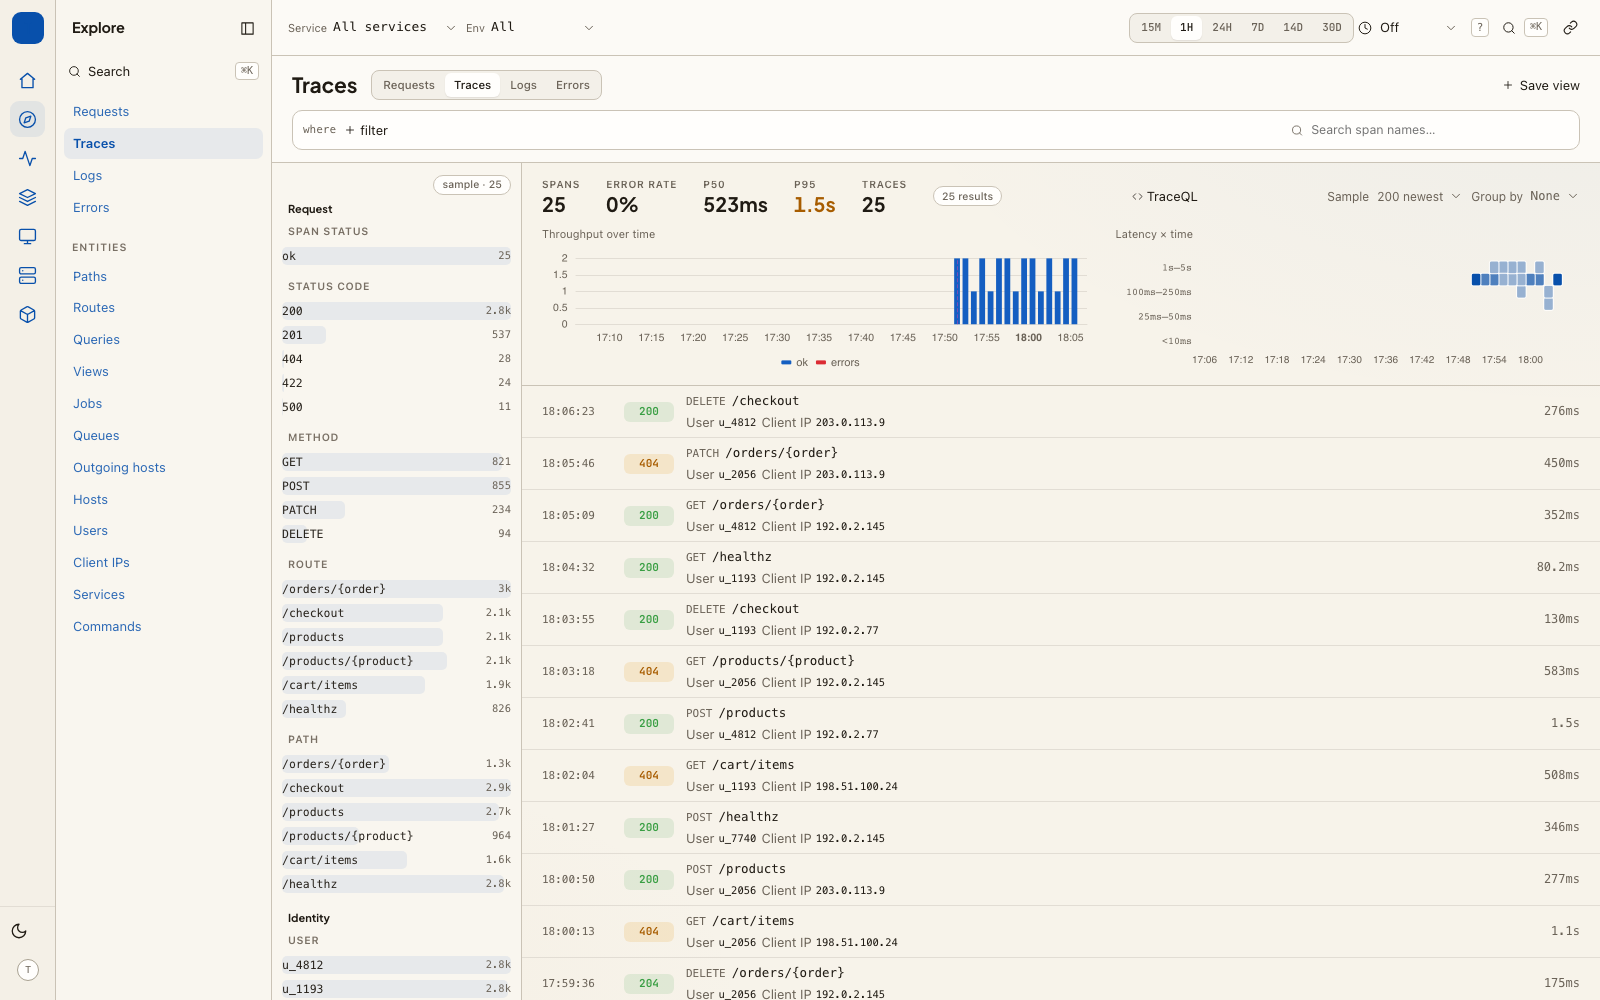
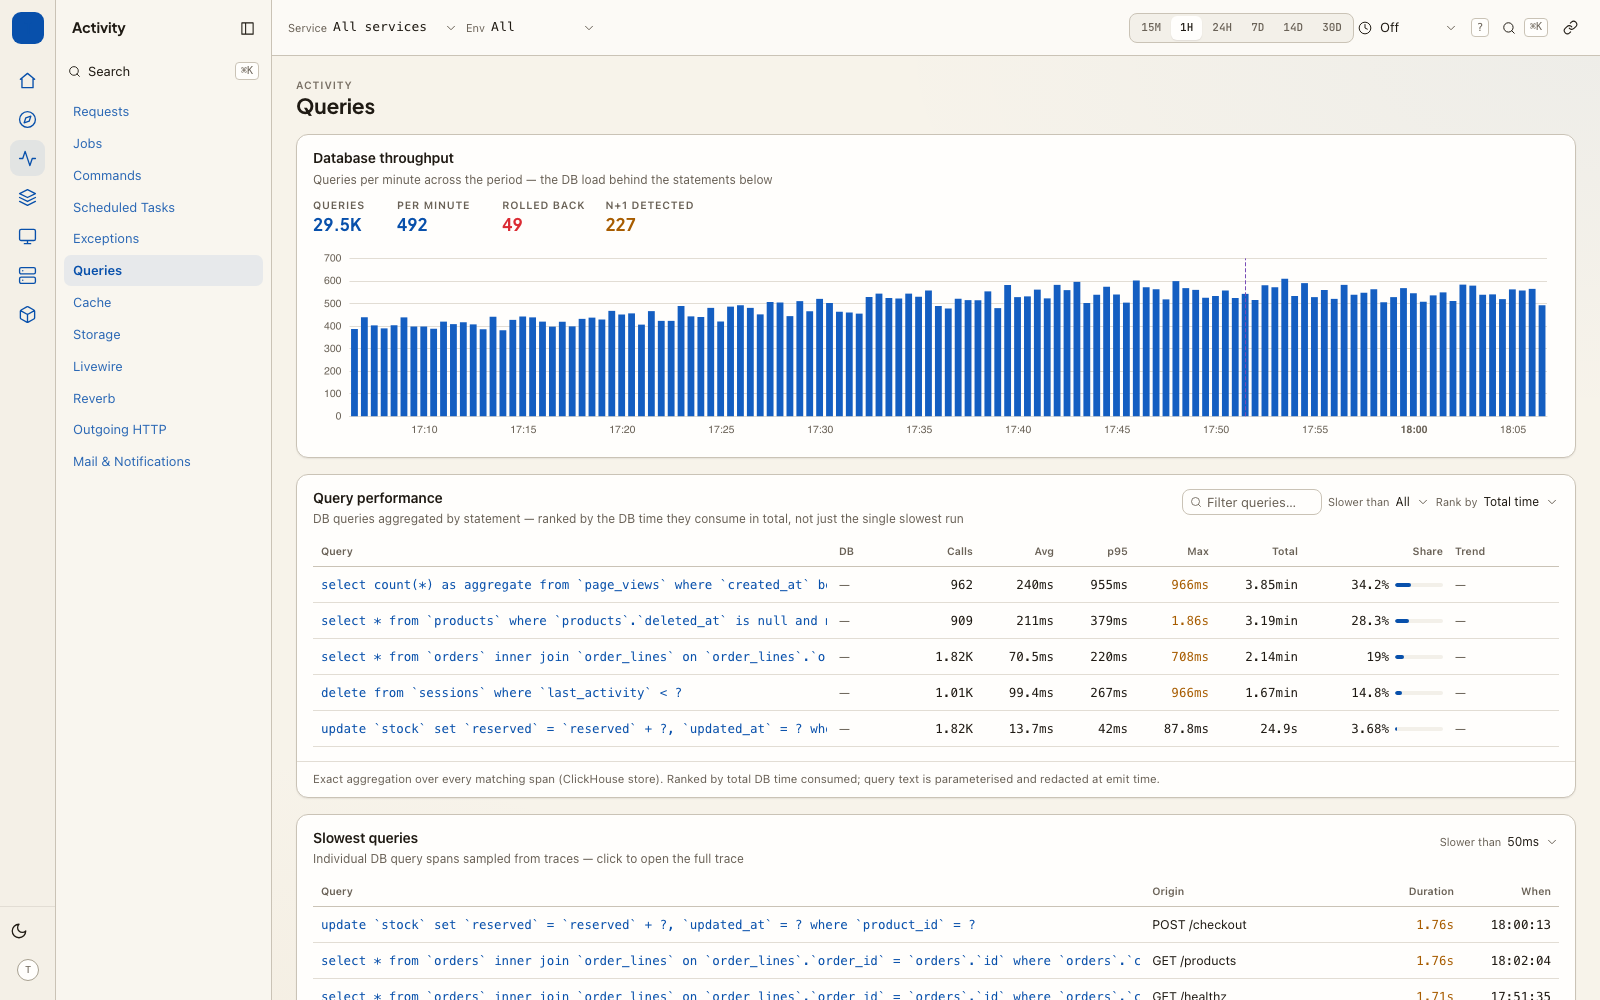
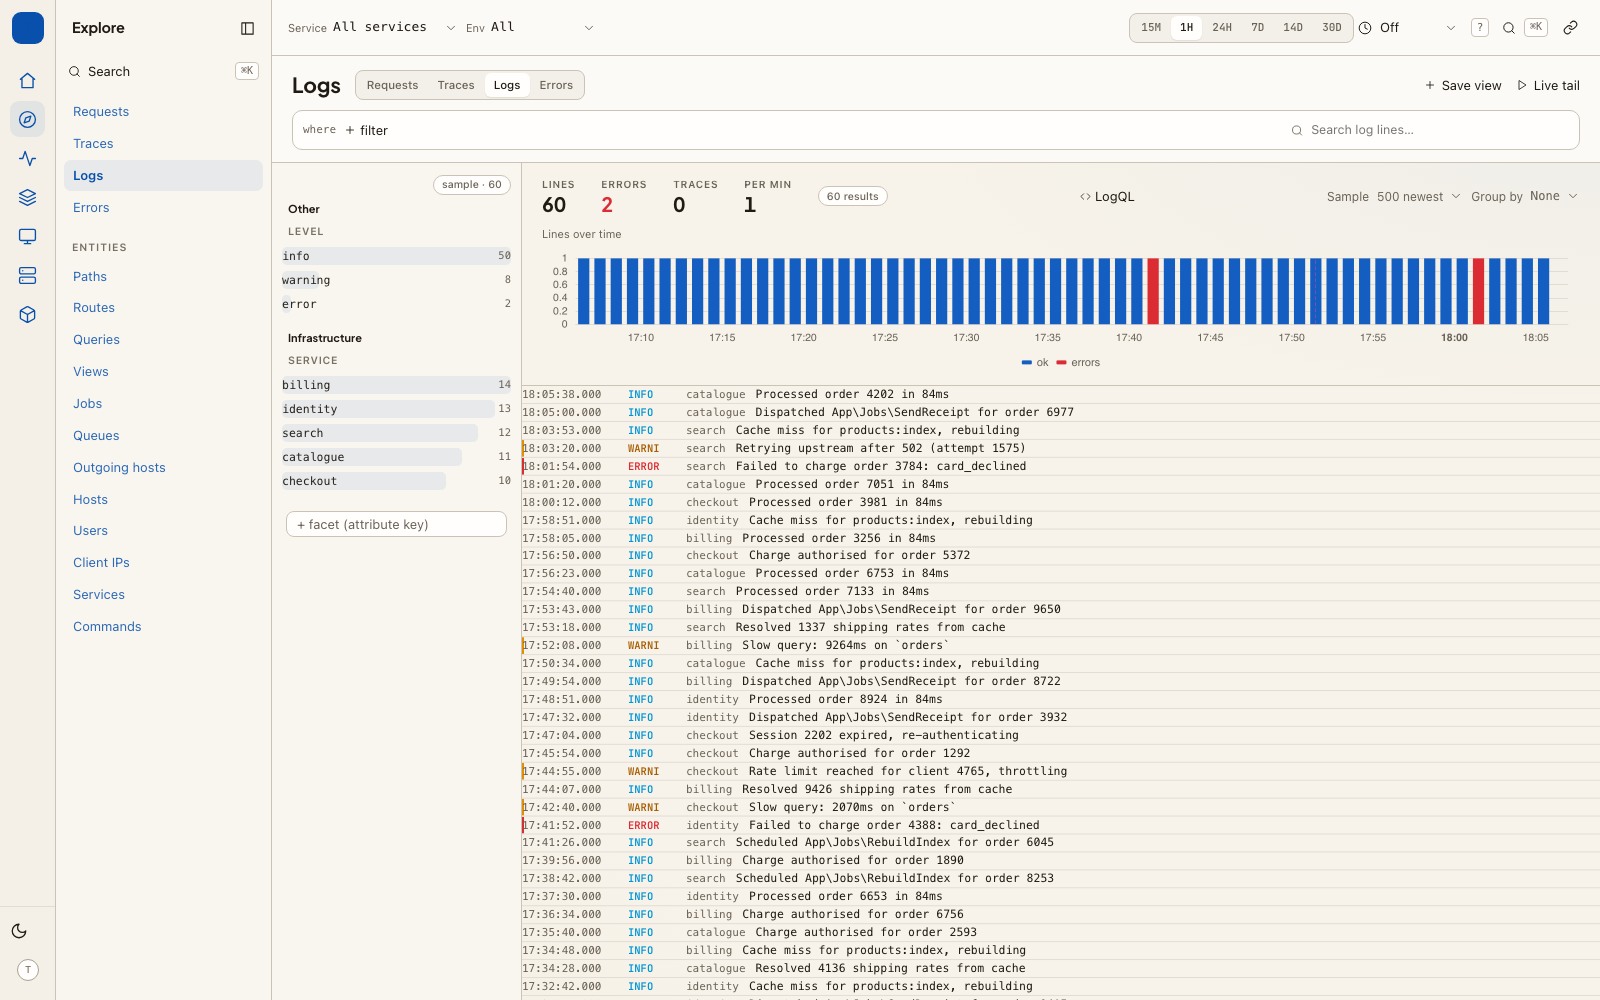
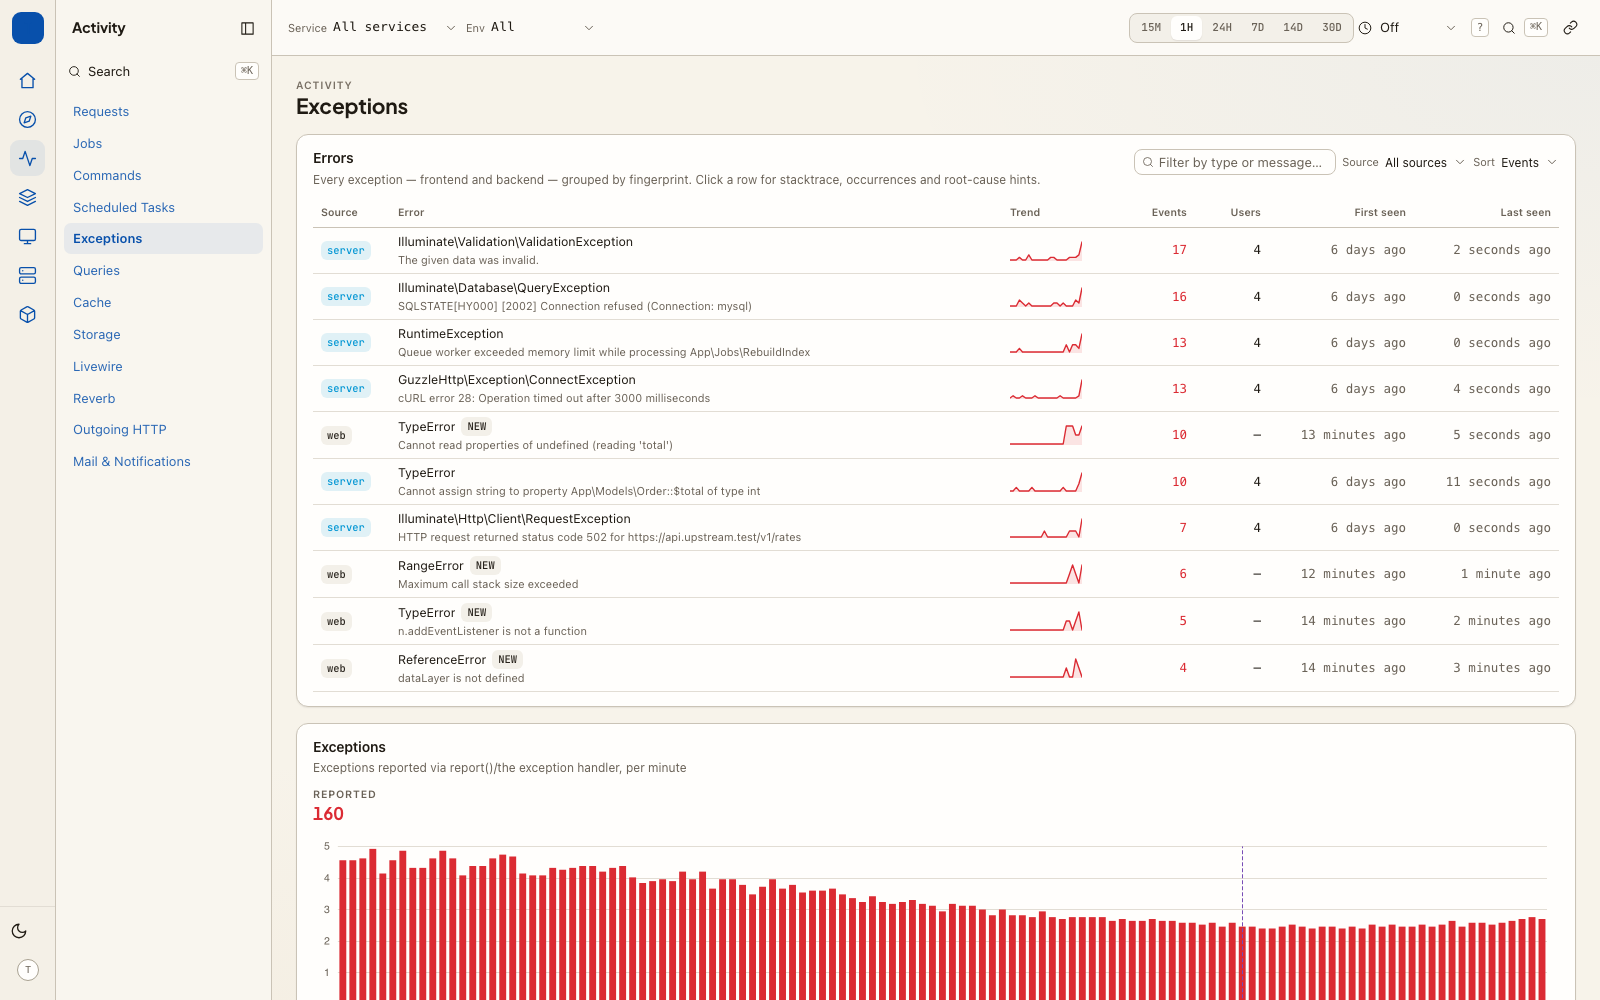
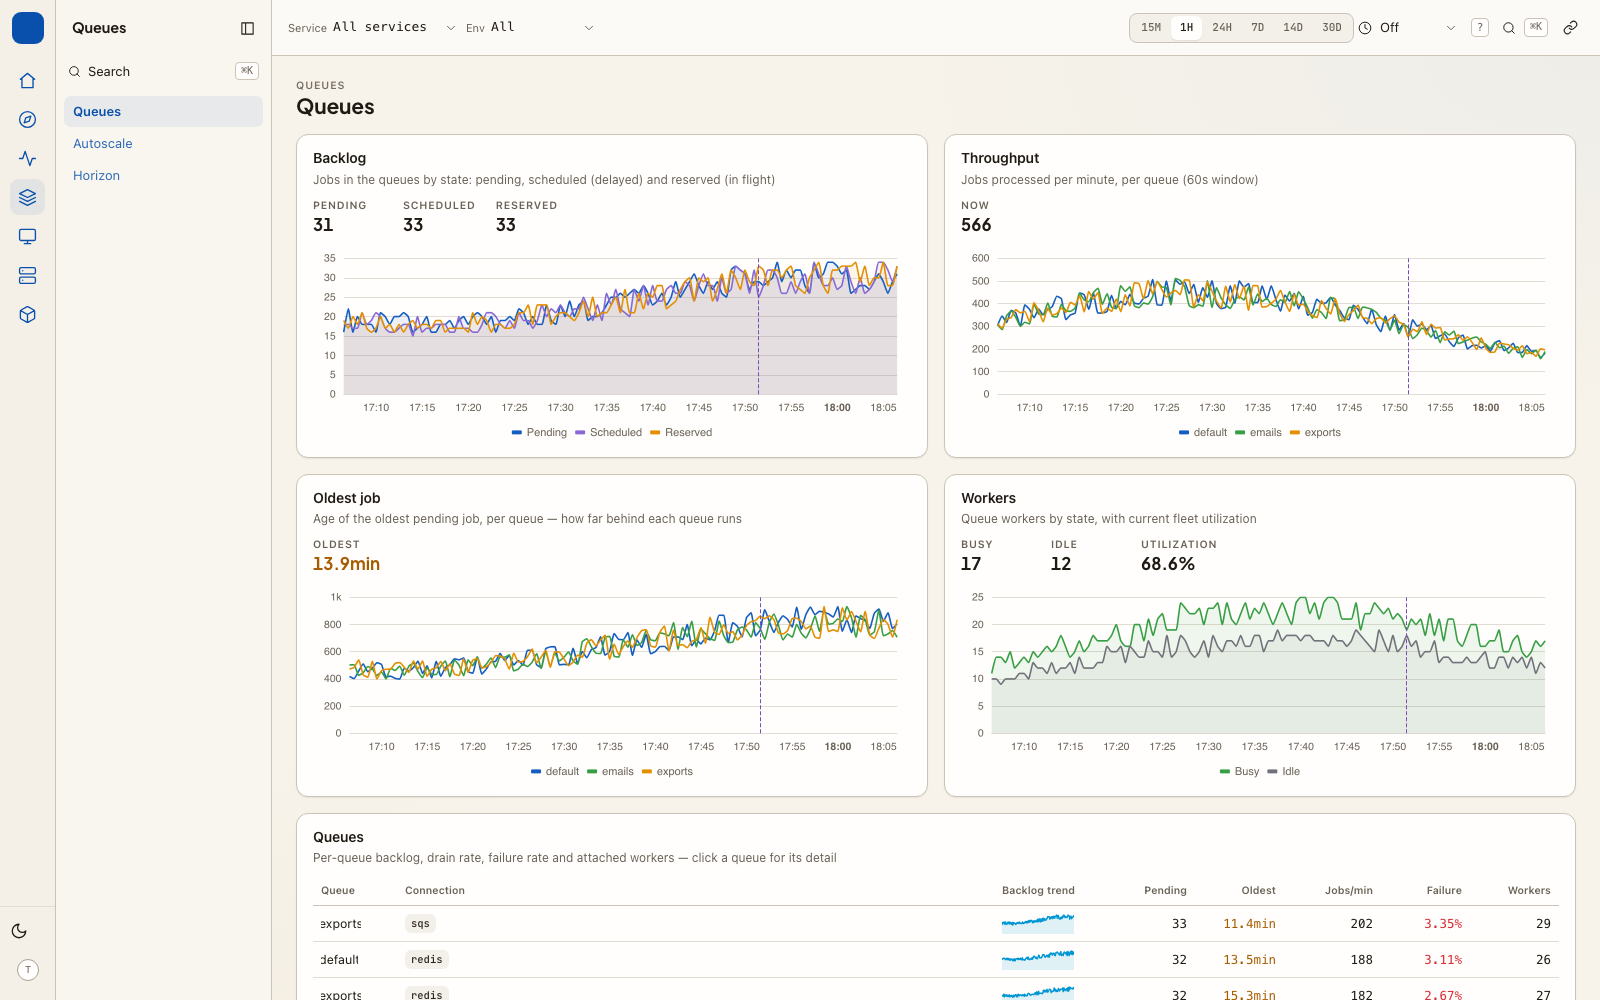
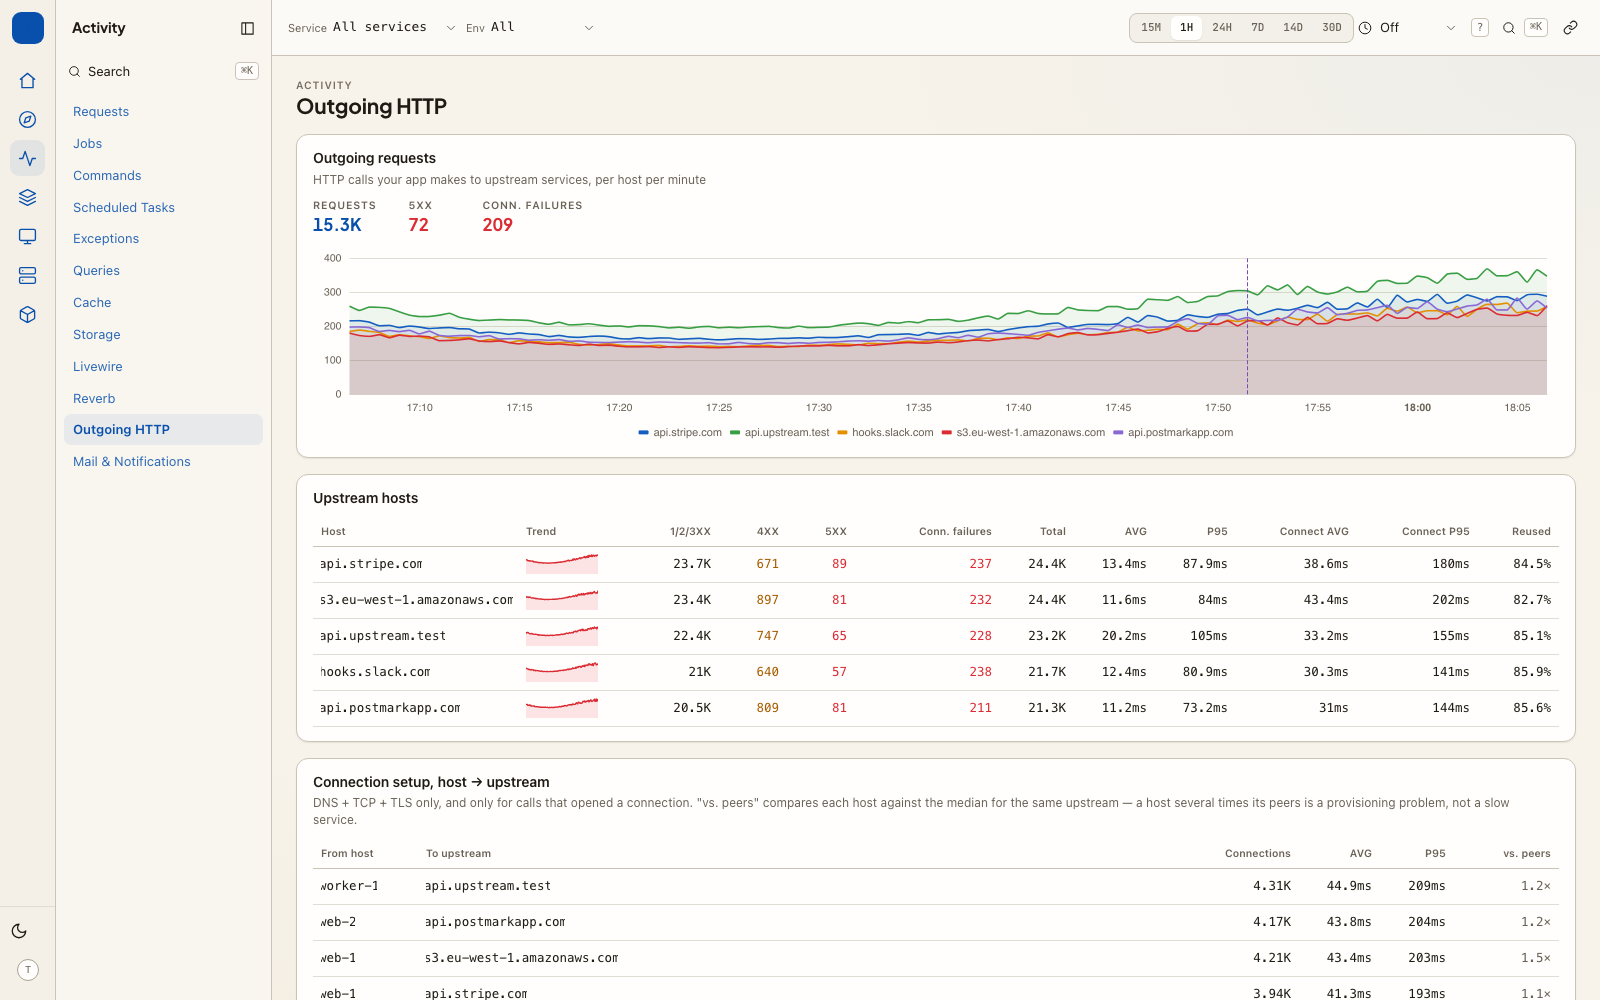
The infrastructure pages are shown in infrastructure discovery, and the analytics page in the web analytics cookbook.
Every screenshot here is captured from the package's own browser tests
against the fixture backends, so what is pictured is what the code renders —
not a mock-up, and not a staging environment that has since changed. See
src/Testing/ScreenshotManifest.php.