Infrastructure discovery
Infrastructure discovery
An application-only monitor can tell you a request failed. It cannot tell you the machine was out of memory, the connection pool was exhausted or the cache was evicting keys as fast as you wrote them — because it never sees any of that.
Most of it is already being collected. Self-hosted teams run node_exporter,
redis_exporter, mysqld_exporter. What is missing is the join: knowing that
instance="10.44.0.9:9100" is the box that served the request you are
looking at.
Nothing to configure
Adding an exporter is an infrastructure job. Install it, scrape it, done — this package looks for what is there:
php artisan telemetry-ui:discover
Exporters present  node, redis, phpfpm

 Target         Exporter  Instance              Matched on  Signals
 web-3          node      web-3:9100            instance    6 of 7
 cache-1:6379   redis     redis://cache-1:6379  addr        8 of 8
 web-3          phpfpm    web-3:9253            instance    6 of 6

Exporter instances nothing claims
  postgres  10.44.0.12:9187
  Either this app does not talk to them, or your scrape config names them
  differently from the hosts in your traces.

Hosts with no exporter behind them
  worker-2
Run it on a schedule. Infrastructure changes at deploy speed, not request
speed, so the map is cached — 15 minutes by default
(telemetry-ui.discovery.ttl).
What your traces must carry
The host side needs host.name on the resource of your spans. Without it
there is no way to know which machine served a given request, and
attributing one node's memory to it would be a guess — so the host tiles
simply do not appear.
cboxdk/laravel-telemetry sets it through resource_detection, which
picks up container, Kubernetes and cloud identity. On a plain host that
detection may find nothing, in which case set it yourself. The dependency
side needs nothing extra: server.address is already on every outbound
span.
telemetry-ui:discover shows which of the two it had to work with.
How a match is made
The names come from your own telemetry: host.name on the resource of
every span, and server.address on every outbound call. An exporter
instance is tied to one of those when an identifying label actually
contains it — after stripping scheme, path and port, so
redis://cache-1:6379 and cache-1 are the same machine.
Only evidence counts. When nothing matches, the instance goes in the unmatched list rather than being attached to the nearest plausible host. A confident wrong match would have an incident report describing the memory of a machine nobody touched, which is worse than saying nothing.
Those two unmatched lists are the feature, not the leftovers. A missing signal is invisible by nature — you get one fewer tile and no error — so what could not be placed is printed where you can see it.
What is read from each exporter
Every metric name below was verified against the exporter's own output:
each was run against a real backing service and its /metrics scraped.
That is not pedantry. This package once shipped five context signals of
which four queried names nothing emits, and because a missing metric is
skipped silently, nobody noticed.
| Exporter | Describes | Read for |
|---|---|---|
| node_exporter | host | load, CPU, memory, disk, disk busy, network errors |
| redis_exporter | cache | up, memory vs limit, evictions, blocked clients, rejected connections, hit rate |
| postgres_exporter | database | up, connections vs limit, deadlocks, cache hit rate, locks, longest transaction |
| mysqld_exporter | database | up, threads connected/running vs limit, slow queries, aborted connects, buffer pool hit rate |
| HAProxy (built-in) | proxy | backend status, active servers, queue, response time, connection errors |
| nginx-prometheus-exporter | web | up, active and waiting connections, request rate |
| php-fpm_exporter | runtime | up, active/idle workers, listen queue, max children reached, slow requests |
| elasticsearch_exporter | search | cluster health, unassigned shards, heap, rejected tasks, tripped breakers |
| mongodb_exporter | database | up |
cboxdk/laravel-health |
host | failing checks, load, memory, disk, OOM kills, CPU throttling |
Valkey is read by redis_exporter and emits the same names, so it needs nothing of its own.
Three things the verification corrected, recorded so they are not guessed
again: HAProxy has no haproxy_backend_up (the metric is
haproxy_backend_status), PostgreSQL replication lag is
pg_replication_lag_seconds, and a standalone MongoDB exposes only
mongodb_up through the Percona exporter — everything else needs a replica
set, so nothing else is claimed for it.
Some signals are marked conditional: a replica's lag, a cgroup's OOM kills, a PSI-enabled kernel's pressure. They are absent in most deployments and their absence is not reported as a problem.
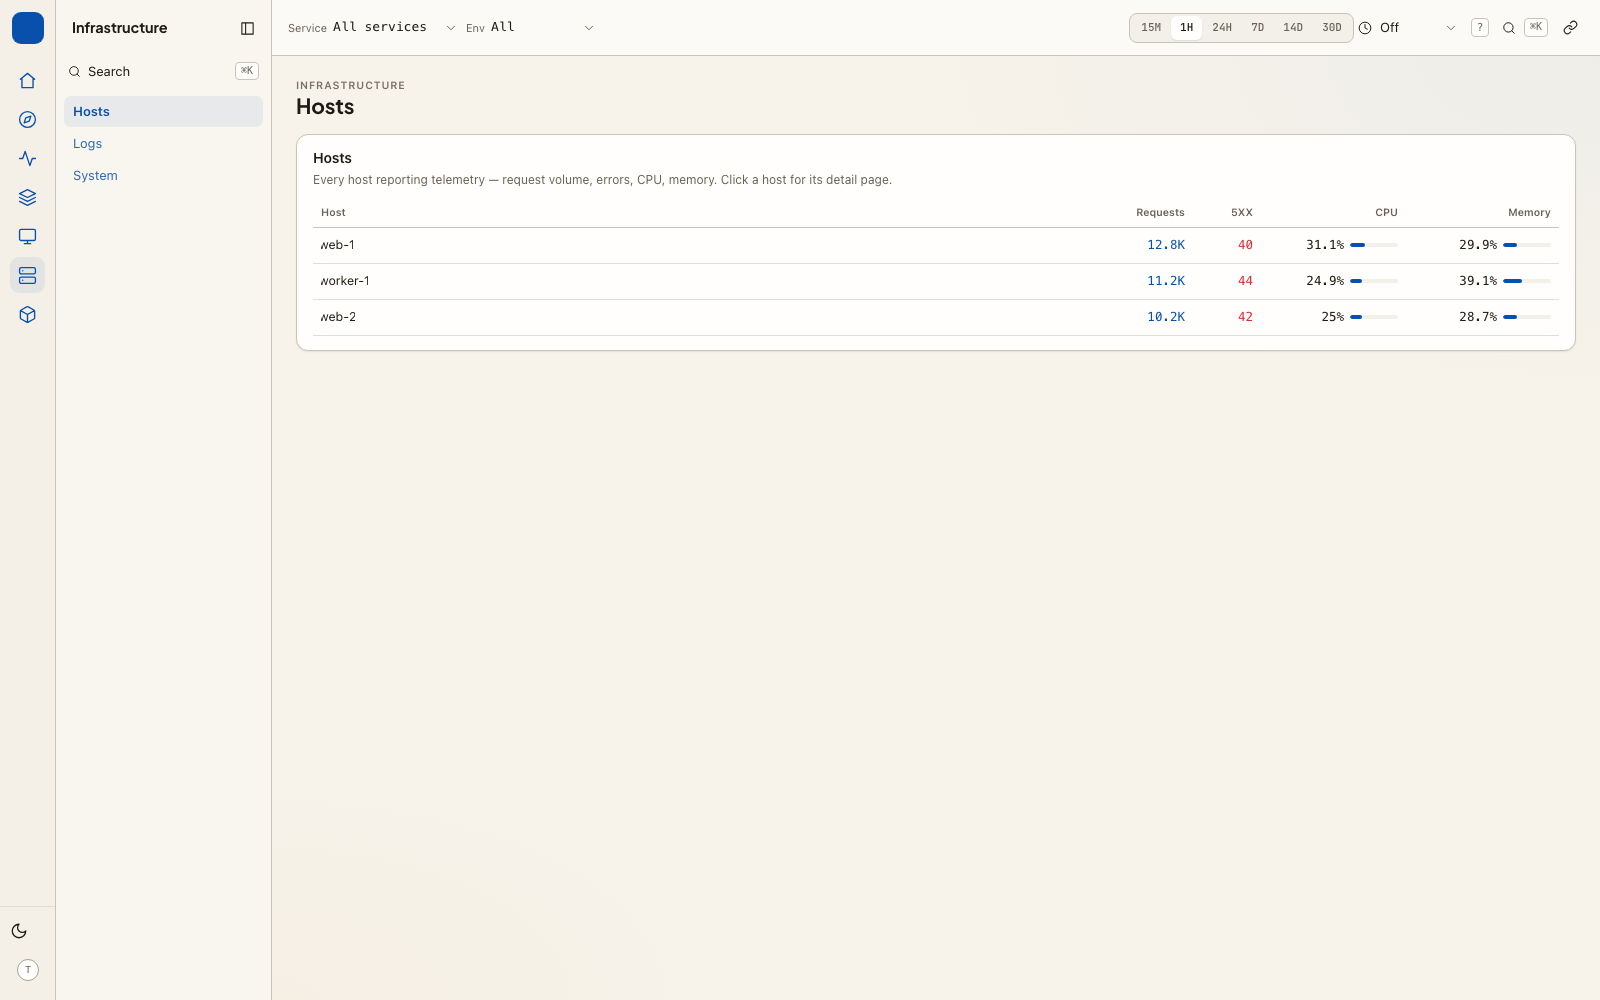
Two pages read the result directly. Hosts lists every machine reporting telemetry, joining the application's own request counts to the CPU and memory the exporter beside it reports:
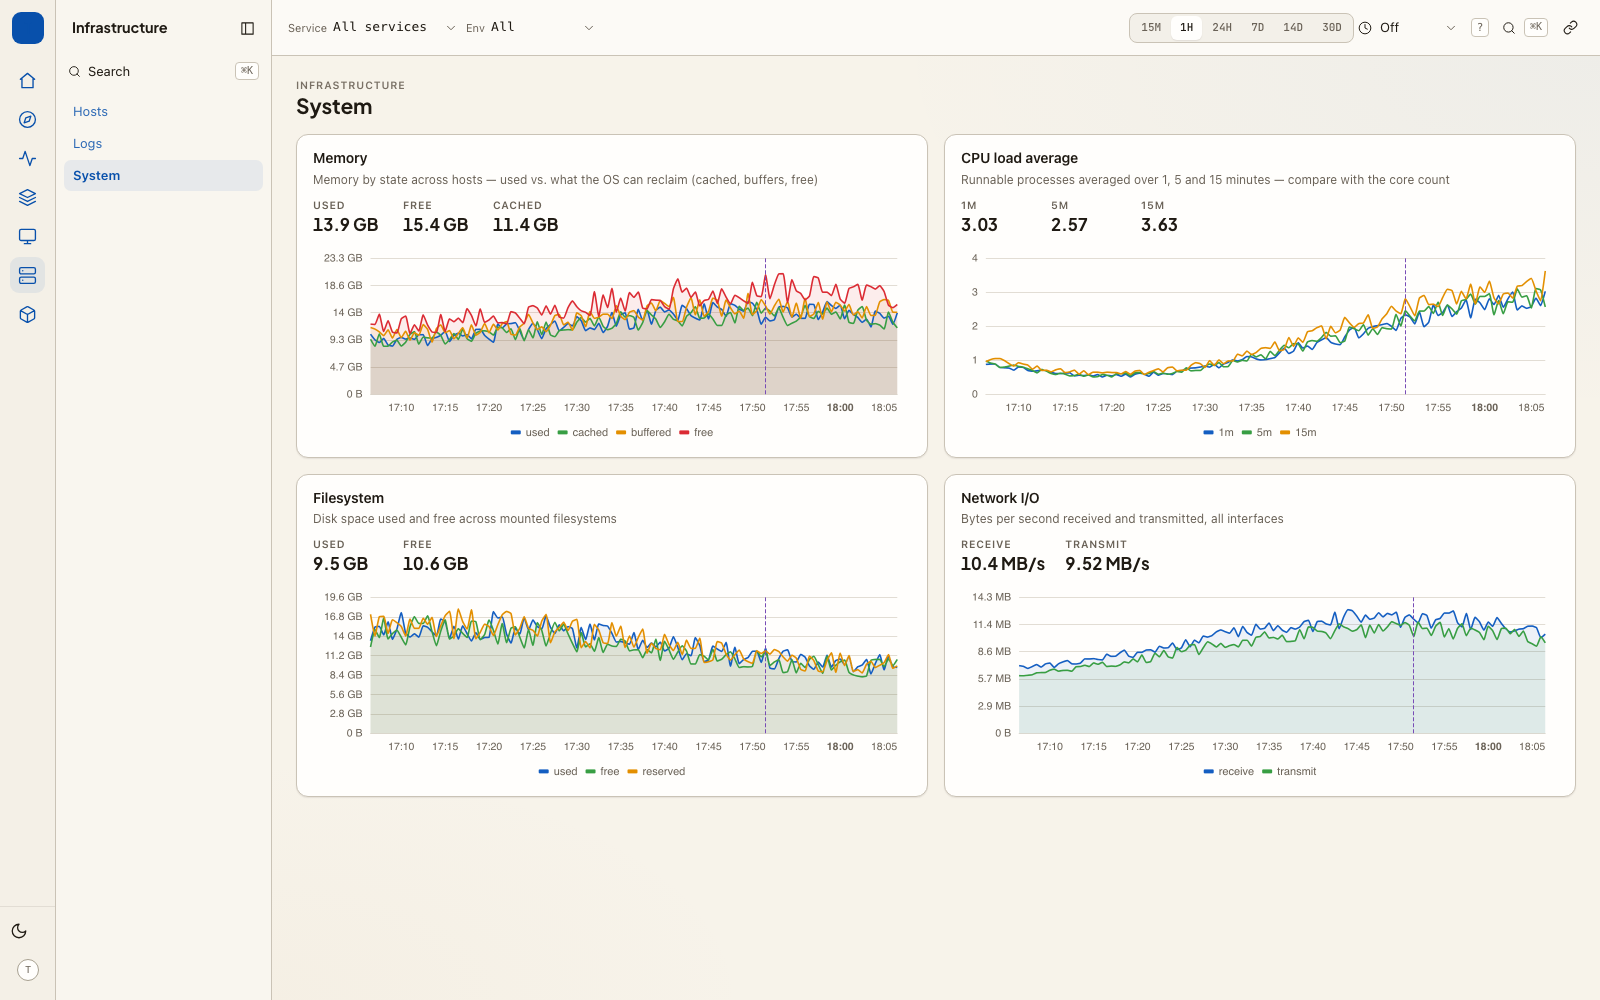
System charts the machine-level signals themselves, carrying the semantic convention attribute keys and units they were emitted with:
What it changes on a trace
Once an exporter is discovered, opening a trace shows what the machine and the downstreams were doing at that moment, beside what the app said about itself:
Host          Load (1m) 14.2   typical 3.1
              CPU busy  97%    typical 34%
Runtime       Active workers 48   typical 6
              Max children reached 0.4/s
Cache         Memory used 3.9 GB of 4.0 GB
              Evictions 4.2k/s   typical 0
Each is held against its own recent baseline, so "97%" comes with "typical 34%" and you can tell a busy machine from a broken one. Only the signals discovery saw return data are queried, so the panel costs nothing for metrics your deployment does not have.
When a signal returns nothing
Discovery probes every signal for every matched instance and records which
ones came back with data. telemetry-ui:discover lists the non-conditional
ones that did not, which is the difference between "your Redis has no
eviction metric because you are on an old exporter" and a feature that
silently does nothing.
The same applies to the trace-context signals, which are separate and
configured under telemetry-ui.context.signals:
php artisan telemetry-ui:check --signals